by
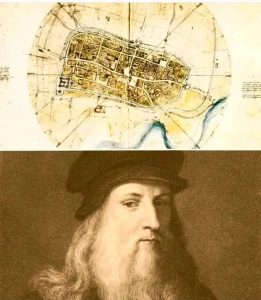
by When we think of Leonardo da Vinci, our minds often turn to iconic masterpieces like the Mona Lisa or The Last Supper. We recognize him as a genius of art, anatomy, and invention. But in 1502, Leonardo found himself in a role that would showcase his scientific and engineering brilliance in an entirely new way: a military engineer for the infamous Cesare Borgia. His task was to map the Italian city of Imola, and the result was a work so revolutionary it wouldn’t be seen again for centuries.
The maps of the early 16th century were often as much works of art as they were tools for navigation. They were typically drawn from a side-view perspective, adorned with elaborate illustrations and filled with a blend of known geography and mythical conjecture. They were beautiful, but rarely precise.
Leonardo, however, had a different idea.
Instead of a traditional, artistic map, he created a shockingly accurate, top-down plan of Imola—a view so precise it is eerily similar to what we see today in a satellite photo. This wasn’t just a map; it was a transition from what the text calls “a geography of myths and perceptions to a geography of information.” It was a monumental leap forward in cartography, and it begged a fundamental question: How did he do it?
Leonardo’s genius lay in his ability to apply a scientific, data-driven approach to a task traditionally dominated by artistic license. He didn’t have a bird’s-eye view, but he created one using a combination of ancient inspiration and ingenious surveying techniques.
His method was rooted in the concept of an ichnographic plan, an idea borrowed from the Roman engineer Vitruvius. An ichnographic plan is a ground-plan drawing that shows a top-down view of a structure. While Vitruvius applied this to a single building, Leonardo had the breathtaking vision to apply it to an entire city.
Here’s how the process is believed to have worked:
- Measuring Angles: Leonardo would have used a sophisticated surveying instrument—likely a disk with a pointer—to meticulously measure the angles of the city’s streets and walls. By establishing a stable central point, he could record the precise angle of every significant corner and turn relative to true north.
- Determining Orientation: A compass would have been used to set the primary orientation of the city walls, providing a critical fixed reference point for the entire map.
- Calculating Distances: To bring the angles to life with a true scale, he had to measure the distances between each of these points. This was likely done on foot with a “spinning wheel odometer,” a simple but effective device that recorded distance as it rolled.
By combining this treasure trove of precise angular and distance measurements, Leonardo was able to mathematically reconstruct the entire city plan. He essentially reverse-engineered a satellite-like view from the ground up, a feat of both engineering and symbolic imagination.
The result was a map that was not just a guide but a blueprint—a tool for analysis and strategy. Despite a few artistic licenses that may have been a nod to older traditions, the map of Imola was a profound statement. It demonstrated that by applying scientific rigor and mathematical precision, the world could be represented not just as it appeared, but as it truly was. It was a map ahead of its time, a testament to Leonardo’s multifaceted genius, and a powerful reminder that the seeds of our modern technological world were planted centuries ago by a man who dared to see the world from a different perspective.